Imports absorb much of the AI investment surge, so a bust would hit GDP mainly through household wealth. Benchmark math still keeps growth positive.
Here's the thing about the AI investment boom: a large share of its GDP lift never stays home. Imports of computers, peripherals, and semiconductors absorb much of the capital spending surge, so a pullback would remove less domestic output than the headline capex numbers imply. That's the part that gets lost when the story is told as a simple cause and effect. The money leaves as dollars spent on equipment, but much of that equipment is built abroad and comes back in as imports.
Imports absorb much of the surge
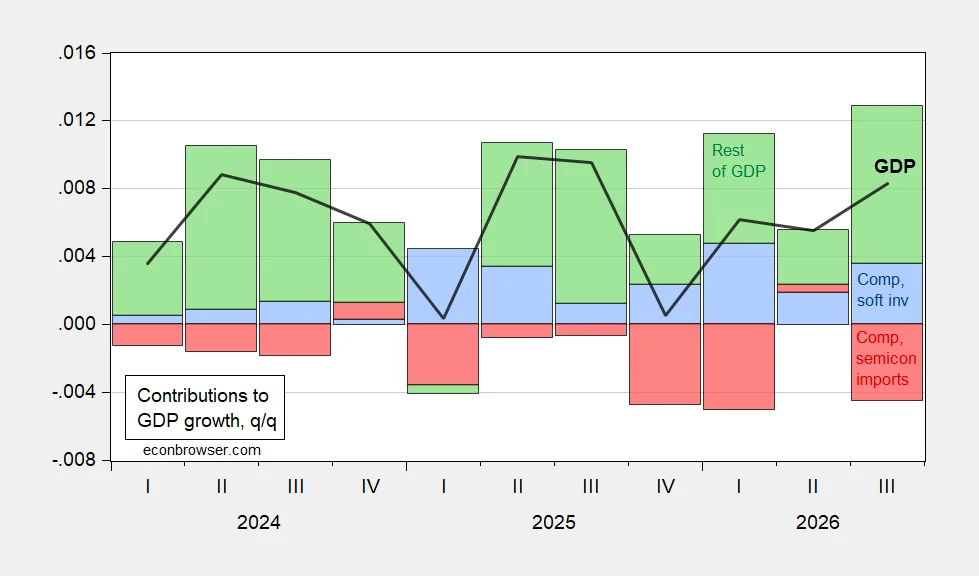
The accounting is straightforward. Computer and software investment pushes quarterly GDP growth up, while imports of the same categories pull it back down. Figure 1 shows the two effects side by side. Adding data center construction, which sits outside the capex component, through 2025, the latest year with available data, doesn't change that picture. Construction is a different kind of spending, and it's mostly domestic, but it isn't large enough on its own to flip the sign of the net effect. If you're trying to judge how much of a boom is really American output, this offset is the first thing to check.
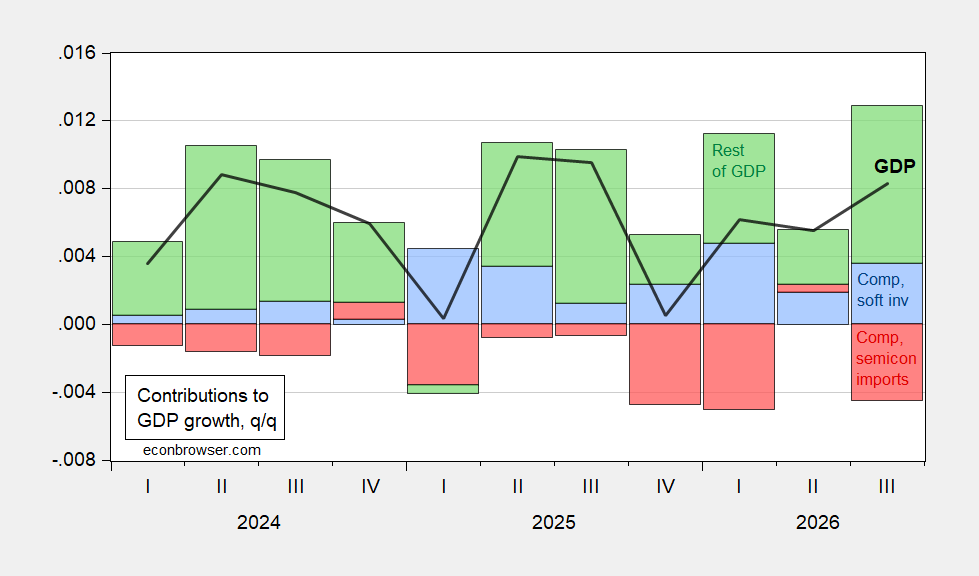
Figure 1: Quarter-on-quarter GDP growth (black line), with contributions from computer and software investment (blue bar), imports of computers, peripherals, and semiconductors (red bar), and the rest of GDP (green bar), all not annualized. Source: BEA, author's calculations.
Read the chart with one eye on the bars and the other on the black line. When the blue bar grows, the red bar tends to grow alongside it, because a large part of the hardware being bought is imported. The net result is smaller than the investment figure alone suggests. This is more significant than it looks, because headline capex coverage tends to treat the investment bar as if it were the whole story.
The net effect depends on Keynesian multipliers. If investment and imports carry roughly the same multiplier, an end to the boom roughly washes out at the GDP line. That's a big if, and it's the assumption I'd stress-test first. Multipliers vary with how spending is financed, how much slack the economy has, and where the money ends up. Data center construction, for instance, supports local labor and materials in a way that imported chips don't, so the two flows aren't interchangeable. Treat the washout result as a useful starting point, not a conclusion.
The wealth channel is where the damage lands
The sharper risk runs through expectations. The capex boom rests on bets about how much AI will eventually pay. If those bets get repriced, whether because spending plans outrun financing capacity or because the perceived policy backdrop shifts, asset prices fall and households spend less than they otherwise would. Nobody has to cut a factory order for this to hurt. A falling stock market can slow consumers on its own, and that's the channel that tends to surprise forecasters.
Nobody can forecast AI-linked asset prices with confidence, so I'm using a simple benchmark: no recovery in stock market capitalization in Q4. Household net worth falls under that scenario, and holding everything else constant, consumption growth slows. The benchmark is deliberately blunt. It doesn't model panic selling, credit tightening, or a rebound in some other sector, and any of those could change the path considerably. Still, it isolates the mechanism well enough to be useful.
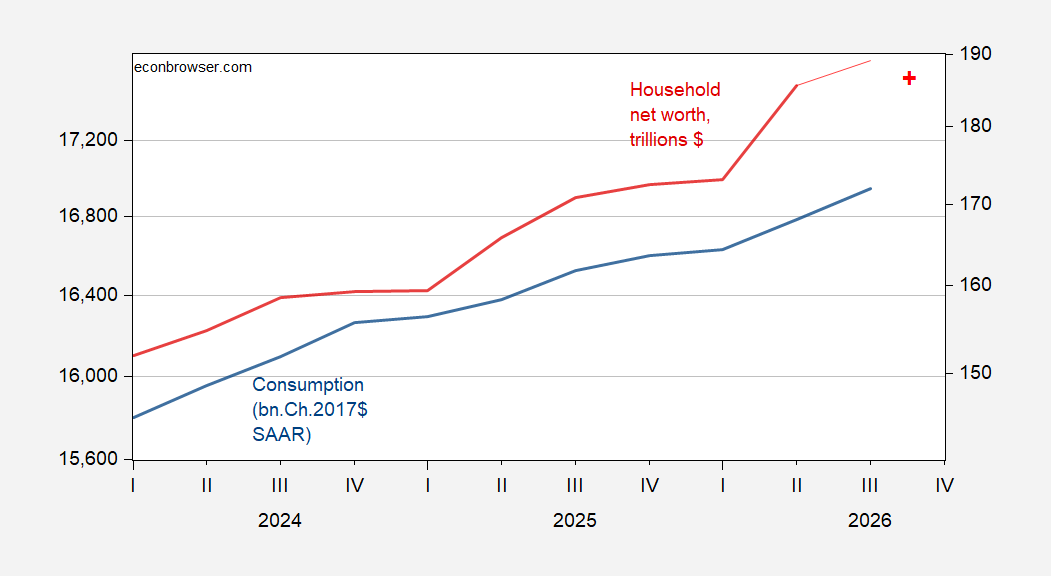
Figure 2: Consumption in billions of chained 2017 dollars, seasonally adjusted annual rate (blue, left log scale), and household net worth in trillions of dollars (bold dark red, right log scale). Also shown are implied net worth with non-equity wealth held constant, a $3.4 trillion increase in stock market capitalization, and a $3 trillion reduction. Source: BEA, Federal Reserve Flow of Funds, author's calculations.
The scenarios in Figure 2 are useful because they show the asymmetry at a glance. Net worth moves with equity prices, and consumption moves with net worth, but only partly. Households don't spend every dollar of paper gains, and they don't cut spending one-for-one when portfolios drop. That partial response is exactly why the wealth channel matters, since a modest change in wealth can still shift consumption in a way that's hard to offset quickly.
Bigot and Espic (2026) estimate that about half of the 2% consumption growth recorded in 2025 came from higher equity wealth. Their figure rests on a marginal propensity to consume out of wealth of roughly 0.027, or 2.7 cents per dollar of equity wealth. That's the number that matters here, and it's smaller than many people expect. Yet when it's applied to a large equity base, it adds up. A meaningful slice of recent consumer spending rode on stock values, which makes consumption more exposed to a market correction than the headline figures let on.
Growth stays positive, but the tail gets fatter
Consumption grew 2.5% in the year through Q3. Run the wealth effect through that base, holding all else constant, and GDP growth doesn't turn negative. That's roughly where the consensus sits. The mechanical case, in other words, is a slowdown rather than a recession. That's a reassuring baseline, but it's also a narrow one, since it assumes the adjustment happens smoothly.
Smooth adjustments are the exception, not the rule. A disorderly repricing brings its own drag, since elevated uncertainty weighs on aggregate demand even before the wealth math kicks in. Firms delay hiring, households hold back on large purchases, and lenders get more cautious, and none of that shows up cleanly in a simple wealth model. That said, the models aren't useless. They just answer a narrower question than the one people are actually asking.
The mechanical case looks manageable. The adjustment path is where the forecast gets hard, and that's the part to watch. A slowdown that stays contained and a slowdown that cascades can start from the same equity decline, and the difference lies in how confidence, credit, and investment respond in the following quarters.
What this means if you're watching the data
If you're working in this space, the practical takeaway is to read the GDP headline with two adjustments. First, subtract the import leakage from any investment-driven growth story, because that's where much of the apparent strength goes. Second, track equity wealth as closely as you track the capex numbers, since the consumer side of the economy now depends on it more than the usual indicators suggest.
What this means for you depends on your role. If you're modeling demand, the multiplier assumption deserves more scrutiny than it usually gets. If you're covering the economy, the real story isn't whether AI spending falls, but how much of the broader economy is quietly tied to asset prices that could reprice quickly. I'd argue that's a more useful question, and far less comfortable, than the usual debate about whether the boom is real.
Discussion
Sign in to join the discussion.