A term spread model flags a false 2024 German recession, but adding the debt-service ratio removes it. Employment, GDP and output data tell a split story.
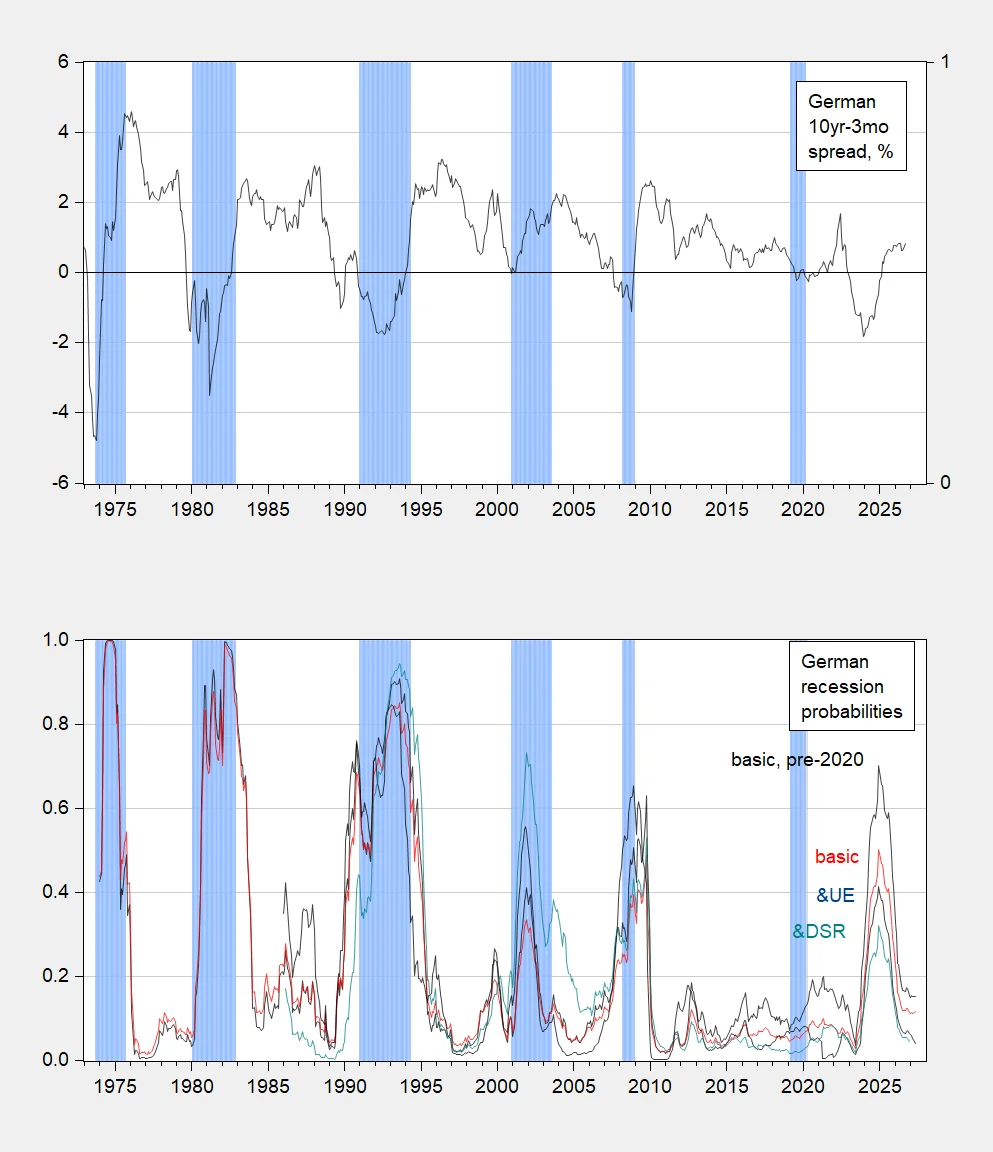
The German yield curve has a good track record, but 2024 is where it looks shaky. The 10-year minus 3-month spread inverted in December 2022, and a plain-vanilla spread regression put the implied recession probability at 70%. That's a high reading, and the recession it pointed to never showed up in the dating that matters.
Until now, the spread had been a reasonable predictor of German recessions as dated by ECRI, which is why the miss matters. A signal that has worked before gets trusted, and trust is what makes a miss expensive. If you're working in this space, the question isn't whether the yield curve is broken. It's whether it's still doing the job you thought it was doing.
Re-estimating the probit
Chinn and Ferrara (2026) estimate a probit on the spread using data through December 2019, then test the model over the full sample. That's a sensible design. You fit the model on a stretch before the pandemic distorted everything, then see whether it holds once the shock arrives. The black line in the bottom panel of Figure 1 shows the pre-pandemic fit. Both the term spread and short-rate specifications explain a relatively high share of variation, before and during the full sample.
At a 40% threshold, every recession except 2020 gets flagged. The catch is a false positive in 2024. (And this is the part most people overlook: the 2020 miss isn't really a failure of the curve.) Sudden external shocks like a pandemic typically aren't what term spreads are built to anticipate, so missing one tells you less than missing a slow-building downturn would.
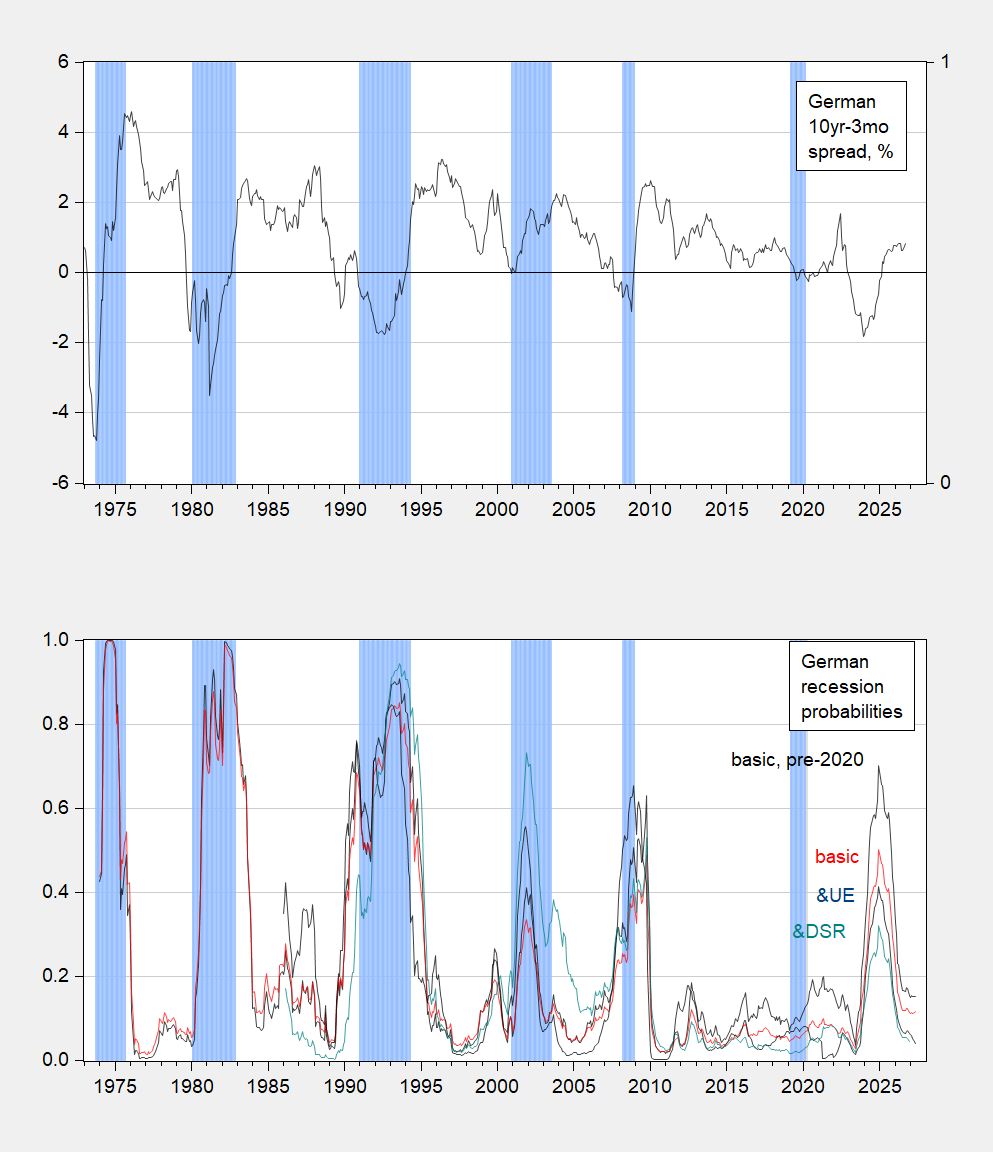
Figure 1: Top panel: 10-year minus 3-month German term spread, percent (black). Bottom panel: probit estimates from regressions on the spread and short rate, pre-pandemic (black line), full-sample (red), with expected change in unemployment (blue) and debt-service ratio (green). ECRI peak-to-trough recession dates shaded light blue. Sources: OECD, Chinn and Ferrara (2026).
Adding the expected change in unemployment lifts pseudo-R² to 0.29, compared with 0.19 for the basic specification over the same sample. Pseudo-R² is a cousin of the R² you know from linear regression, and it runs lower by construction. So treat 0.29 against 0.19 as a relative comparison, not a score out of one. That's a real improvement in fit, and it isn't nothing.
But the recession calls barely move. 2024 still registers as a false positive at 40%. That tells you the better fit isn't mainly coming from sharper timing near the threshold. The added variable is improving the model's overall shape, not fixing the specific call that went wrong.
The debt-service ratio changes the picture
The debt-service ratio does more work. Pseudo-R² rises to 0.33 from 0.19, every coefficient enters with the expected sign and is statistically significant, and at the 40% threshold, 2024 drops out as a false positive. That's the result I'd flag first.
Why would this variable succeed where the spread struggles? A debt-service ratio tracks how much income goes toward servicing debt, so it speaks to balance-sheet strain rather than the slope of interest rates. A yield curve can flatten or invert for reasons unrelated to how stretched borrowers are. When the debt burden is the thing that matters, the curve is looking at the wrong symptom. That's a general pattern in this category of model, not a claim about any specific episode.
The variable also produces quite different results for the US, which suggests the spread alone misses something about debt burdens that matters in Germany too. I'd be cautious about reading too much into a cross-country contrast drawn from one specification. Still, it's a fair hint that debt isn't a side issue, and that a model without it is missing part of the story.
Was there a recession after all?
One way out is to argue Germany did have a recession in 2023–24. The IMF's Kemp (2026) writes that “Germany’s economy experienced a pronounced recession during 2023–24, with real GDP contracting and growth falling notably behind the rest of the euro area.” That's a serious view, and it isn't a fringe one. The claim is about the level of activity and relative growth, not a single bad quarter, and a skeptic has to engage with that directly.
But neither ECRI nor the German Council of Economic Experts has dated a post-pandemic recession, and the indicators help explain why. Dating committees tend to look for broad, sustained declines across several measures at once. A contraction that shows up in one series but not the others often gets classified as something else, such as a stagnation or a sector-specific slump. Whether that's the right call here is a judgment, and reasonable analysts can disagree.
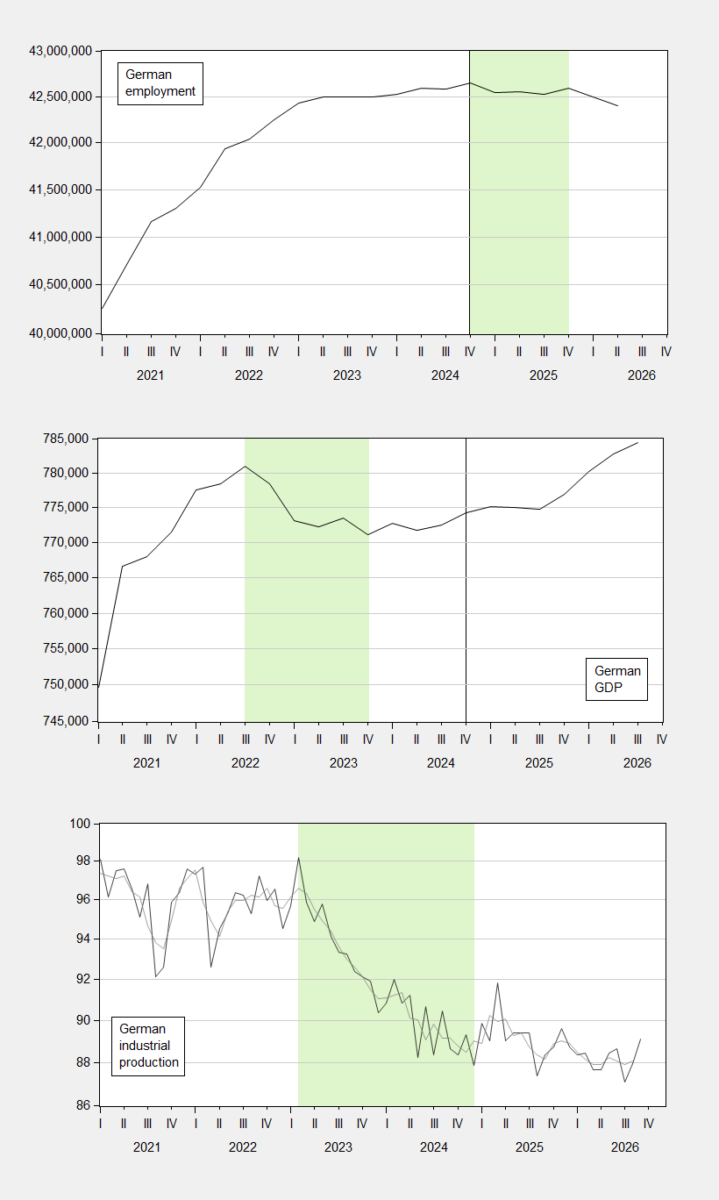
Figure 2: Top panel: German employment, age 15 and over. Middle panel: German real GDP, billions of 2010 euros, seasonally adjusted annual rate. Bottom panel: German industrial production excluding construction, three-month centered moving average. Light green shading marks peak-to-trough movements. Sources: OECD via FRED, OECD.
The peaks don't line up. Employment peaked in 2024Q4, GDP in 2022Q3, and industrial production in February 2023. The recession probability peaked in December 2024. Read in order, those dates don't describe one recession unfolding. They describe several weakening series that peaked at different times.
A recession, in the usual sense, requires a broad and sustained decline in economic activity, and these series don't fall together. That's a useful test to apply to any headline that says "recession" without qualification. Ask which series fell, when they peaked, and whether they peaked together.
What the peaks are telling us
The most charitable read is that the term spread caught the employment downturn but missed the declines in GDP and industrial production. Employment is the series that peaked last, so the spread's signal lines up with the late part of the sequence rather than the early part. That's an awkward fit for a model meant to give early warning. It's more likely a lagging echo than a leading call.
That's a narrower signal than a recession call. It also makes the debt-service result the more useful test to watch as more data comes in. Here's the thing, though: a narrower signal is still a signal, and it isn't the same as being wrong. The spread may be telling you something real about labor markets while saying nothing about output.
Implications and what to watch
The bigger implication is about how much weight any single indicator should carry. A yield-curve model that worked in earlier episodes can still fail when the economy's weak spots shift. That doesn't make the spread useless. It makes it one input among several, and the 2024 episode is a reminder to check which input is actually driving a call.
What this means for you depends on what you're using the model for. If you're reading recession probabilities as a single number, the 70% figure deserves more skepticism than its precision suggests. If you're building a monitoring framework, the debt-service result argues for keeping a balance-sheet measure next to the curve. Neither conclusion requires predicting what comes next.
And yet the open question is genuinely open. Revisions to the employment, GDP, and production data could change how these peaks look, and dating committees may revisit their calls. That's worth tracking, but it's a different thing from having a verdict. For now, the honest summary is that the curve gave a loud warning in 2024, the debt-service variable offered a quieter and more accurate one, and the dating question remains unresolved.
Discussion
Sign in to join the discussion.